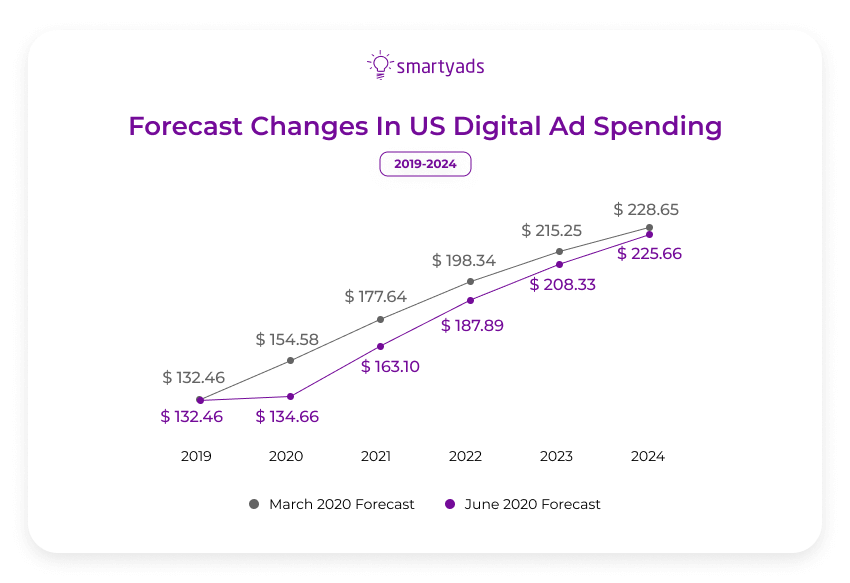
In recent years, advertisers have been increasing their ad budgets; eMarketer forecasts that mobile ad spend in the U.S. alone will hit $161.49 billion by 2024. The increase in mobile app spending has heightened the need and importance of mobile advertising attribution which helps advertisers find out how to connect with their target audience. But how does its mechanism work, and what does the landscape of mobile app tracking attribution look like in 2024?
What is mobile attribution?
Mobile attribution is about where users come from before installing a mobile app or making a purchase. It provides marketers with real-time data on where their campaigns work best and allows them to see how mobile users respond to creatives.
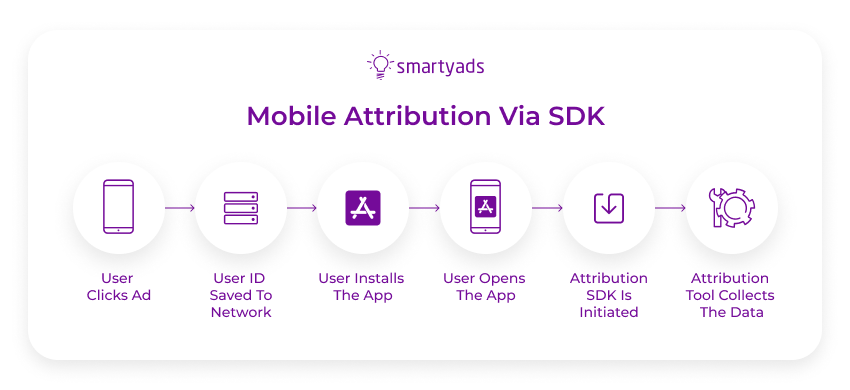
Using cookies, image pixel tags, etc, a mobile attribution platform enables tracking of user actions (events) after an app install. Such conversion data points and granular insights are essential for a successful mobile retargeting or mobile marketing strategy.
Besides initial ad campaigns, mobile attribution delivers value for retargeting. For instance, previous app users who uninstalled an app can be retargeted for the same app. This helps marketers optimize their ad strategies.
4 essential metrics for mobile attribution
There are different metrics used for mobile and app marketing attribution, let’s review some of the most popular.
Conversion Rate (CR)
Conversion rate is the ratio of installations of a mobile app to the overall number of clicks coming from an advertising campaign. It is calculated as the percentage relationship between the total (for the reporting period) a number of installations and clicks.
Conversion Rate (CR) = (Number of Installations / Number of Clicks) * 100%
Example: 400 installations / 10,000 number of clicks on the ad) * 100%
≈ (0.04) * 100% ≈ 4%
This means that out of every 100 clicks on the advertisement for the game app, around four users installed the app. Generally, a good conversion rate for app installations can range anywhere from 1% to 10%.
Click-through rate (CTR)
This metric refers to those users who have seen the app or mobile advertisement and clicked on it. A high CTR indicates that the advertisement is sufficiently attractive to the audience.
Since CTR is a good indicator of ad relevance to the target audience, pay-per-click platforms (such as Google Ads and Facebook Ads) use it to determine the quality of advertisements.
CTR = (Number of Clicks / Number of Impressions) * 100%
In mobile advertising, a CTR above 1% is typically considered decent but there are other factors to take into account.
Example: 500 clicks / 10,000 impressions) * 100%
= 5%
This means the CTR is great. However, to determine if it is really good, you need to compare this number to the average CTR for apps in your industry/niche.
User engagement
Mobile attribution tracking often involves such metric as engagement. Engagement Rate is a coefficient that indicates how many users actively interact with the advertising of your mobile application.
Engagement Rate = (Total Engagements / Total Impressions) * 100%
In the mobile advertising industry, an engagement rate above 1% is typically considered good. However, you also need to compare it with the average CTR for apps in your industry/niche.
CPI (cost-per install)
This metric is used in mobile attribution analytics when it comes to apps. It reflects the price of advertising divided by the number of app installations.
If the indicators are low, it is necessary to change the marketing strategy to increase the number of users or installations. CPI helps with this: advertisers only pay if the application has been installed.
CPI= Total advertising cost/number of installs
With this, total ad costs signify how much money advertisers invested in the ad campaign.
Previously, CPI was the most commonly used metric for measuring mobile campaign effectiveness. Today, metrics such as Cost Per Action (CPA) are becoming more popular as they better reflect the complexity of the free app market.
CPA (Cost Per Action)
Another metric frequently used in mobile app marketing attribution. Unlike CPI, CPA (Cost Per Action) indicates the cost per specific action. This action doesn't necessarily imply the conversion of a new user. The action could be subscribing, upgrading to a premium account, or making an in-app purchase.
CPA is a measure of efficiency that ensures payment only upon attracting quality users.
CPA= Number of Actions/Total Advertising Cost
For instance, the CPA is $5, meaning it costs the advertiser $5 to acquire each user who made an in-app purchase through the advertising campaign. Now, is it good or bad? If the average revenue per user exceeds the CPA and the lifetime value of the user justifies the acquisition cost, then a CPA of $5 could be considered good.

Mobile app attribution models
Considering many options to track mobile attribution, marketers and app publishers can create definitive customer journey maps and obtain industry insights that translate into revenue. Every mobile attribution model has distinctive capabilities that drive concrete marketing analytics. Here they are:
First click attribution
This allows mobile marketers to see where a prospect came from as it records the very first attribution data point. For instance, when a user clicks on a Facebook ad, first-touch mobile attribution provides information that the user landed at the e-store via the ad. So, this app tracking attribution helps UA managers discover what channels drive user acquisition most to adjust effectively their mobile user acquisition strategy.
- Pros: it's easy to implement, and it allows brands to generate a high-quality pool of demand since it identifies which first touchpoints drive sales.
- Cons: it provides valuable data concerning only top-of-the-funnel, so marketers can't evaluate the impact of touchpoints that are beyond the first ad click.
Last click attribution
Using this, marketers can track ads that users last clicked on before making an app installation. The problem is that the last click sometimes does not give accurate attribution. For instance, if an email campaign prompts a buying decision but the user clicks on an AdWords ad, this marketing attribution credits the AdWords and not the campaign.
- Pros: this mobile app tracking works best when marketers need insights on the exact action that drove the sale or installation.
- Cons: contrary to the first touch, marketers here are missing data about nurturing a user. So, all efforts on email ads, content strategy, retargeting approach, etc., are staying veiled.
Multi-touch attribution
Multi-touch attribution reveals the whole picture of user journeys by setting equal credit values for each step. It recognizes all advertising channels the user interacts with during their journey rather than just one ad.
- Pros: this mobile attribution works by showing all marketing channels that are used to make a conversion.
- Cons: multi-touch attribution is not easy to release since it requires a solid knowledge of the background from a marketer.
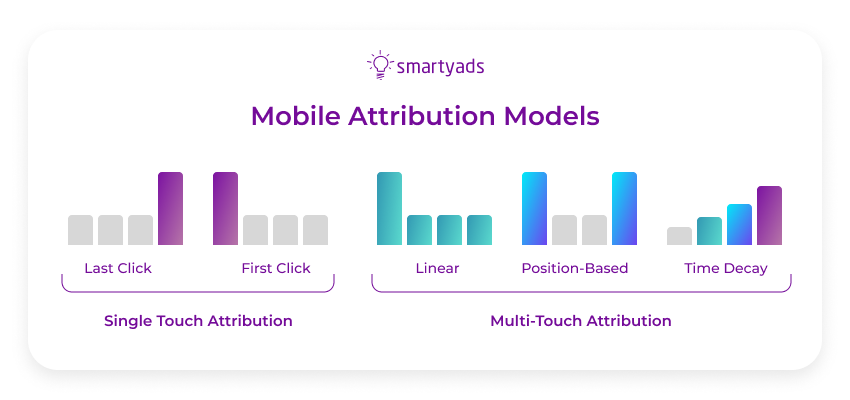
Time-decay attribution
In this case, marketers give more value to recent touches while giving less value to earlier touches. This helps advertisers focus their efforts on the most conversion-driving touchpoints.
- Pros: it covers all touchpoints with a bias on the latest touchpoints that often have a crucial decision-making influence.
- Cons: depending on the goal of a campaign, the top and middle of a funnel might be more important than the bottom one.
U-Shaped attribution
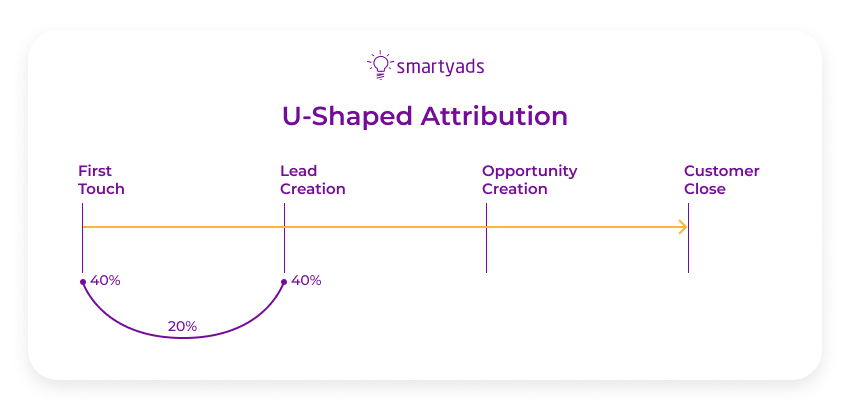
This mobile marketing attribution tool diversifies credits among different touchpoints. Credit for the first and last touch is set at the rate of 40%. The rest 20% is evenly split between other middle points.
- Pros: in many campaigns, the first and last touchpoints are the most decisive so the U-shaped model comprises crucial data about a user journey. Still, it brings some understanding of the intermediary stages.
- Cons: if a campaign has a goal of nurturing a user, this option will underestimate the middle part of a journey that normally contains core data for that purpose.
W-Shaped attribution
It is very similar to the U-shaped mobile app attribution, but it assigns a 30% credit rate between the first touch, lead stage, and last touch. The remaining 10% are distributed to other touchpoints.
- Pros: it shifts attention from auxiliary channels to the main one(s), thus helping to define where the audience comes from, at what middle stages it turns into leads, and see what last actions affect them best to make a purchase.
- Cons: it's not very suitable for B2C mobile marketing that has a short cycle of a user journey as it is designed for long-term campaigns.
View-through attribution
Marketers can now measure conversions that have a time gap between seeing an ad by a user, and ultimate installation. This mobile attribution tool allows you to detect users who watched an ad but didn't click on it though they later took action.
- Pros: this mobile ad approach provides extra data points that extend beyond clicks. Here, advertisers can include in their reports some impressions that weren't clicked, but still, delivered a sale.
- Cons: count of conversions has a time limit. For instance, Google Analytics has a 30-day attribution window when view-through conversions are effective. Attribution windows differ according to provider or platform.

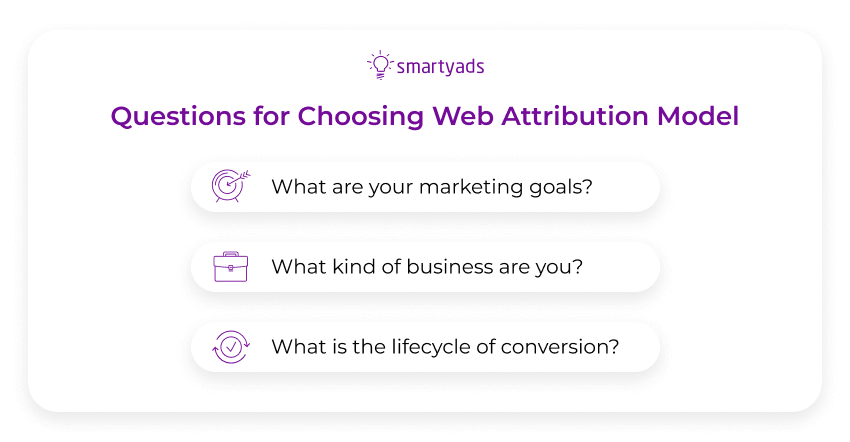
Choosing web attribution model
There are three key questions that a marketer should answer to make the right decision about which web attribution model to use in advertising campaigns.
For starters, you need to know what is mobile attribution window. This is the term that refers to the time frame during which the advertiser expects to receive the desired result from the ad campaign (installs of clicks or else). This time frame should be planned according to the marketing goals you need to achieve.
What are the marketing goals? The ultimate purpose of any business is to drive revenue and user acquisition. To achieve that, a marketing campaign often pursues different outputs.
This can include:
- creation of strong brand awareness;
- leads generation;
- driving conversions.
A clear understanding of the goal(s) will indicate what data points and, subsequently, what part of the funnel (top, middle, bottom) marketers should stick to and what channels to use.
What kind of business are you doing? Usually, mobile marketers are divided into B2B and B2C. While B2B commonly performs omnichannel marketing, B2C is less diverse here. So, in the first case, the linear attribution model can be the clue, and for B2C, the last touch concept should make sense. Your mobile attribution tools and model should be tailored to your business type.
What is the lifecycle of conversion? Long-term sales lifecycles have good odds of bringing value to marketers by running Time Decay attribution. In the short term, such a business can benefit from single-platform attribution options.
Importantly, you may want to work with mobile attribution providers or networks that support all the attribution models.
Challenges in mobile app attribution
There are several challenges of attribution in the mobile environment that every advertiser needs to take into account in order to measure the effectiveness of ad campaigns efficiently.
Data discrepancy
Actions taken across different channels are often not linked together and not compiled into a unified array for reporting. As a result, purchases through various sources, such as applications/websites, are not linked together. Often, there is no understanding of which creatives and campaigns brought the users who installed the application and made purchases and more.
To solve this problem, use mobile traffic attribution is called Mobile Measurement Partners (MMP) or "Tracking Systems." They allow tracking of the depth of app usage, the number of installations through each channel, the audience's target actions, conversion, and many other metrics.
A lot of manual work
If you work manually, you either turn to analytics or manually open the advertising account, extract the information, and consolidate it in Excel. If you run multiple campaigns on Google and Facebook, another problem arises Google attributes according to its model, Facebook according to its own, and the console displays information according to a third model. In this case, you have to choose which model to base on and which information to display in the reports. Again, a good way to avoid it is to use (MMP) or "Tracking Systems.”
Advertising fraud
Ad fraud can affect statistics and deliver incorrect data that could lead to incorrect conclusions. In order to avoid it, make sure to launch your mobile and in-app campaigns only with proven advertising vendors who monitor their traffic and ally with the best fraud protection vendors (Pixalate and others).
New privacy landscape
Since Google announced its intention to phase out third-party cookies, the world of digital advertising has felt strained. This prompted the decision to create app-tracking solutions that are privacy-compliant and maintain industry standards.
Attribution trends in the era of privacy
What kind of attribution options are available for mobile in 2024?
The following mobile attribution and analytics are believed to become a decent substitution for cookie-based mechanisms:
SKAd Network. Apple has developed a proprietary solution — SKAd Network to replace IDFA identifiers in IOS. This solution is a privacy-friendly alternative to cookies that will transmit the number of clicks within the campaign without using personal identifiers.
Fingerprinting. Such attribution is based on specific device configurations (not the actual fingerprinting). As well, it employs first-party data to improve campaign measurement.
Privacy Sandbox from Google. Its API allows marketers to run ads and simultaneously ensure users' privacy. It is definitely a challenging time for mobile app marketing attribution; however, Privacy Sandbox which is currently tested by Google, promises to introduce a working and transparent environment thanks to Attribution Reporting API.
The Bottom Line
By measuring the effectiveness of mobile advertising, you can intelligently allocate your marketing budget, attracting more new customers and increasing sales and app downloads. Still, attribution for mobile can be tricky in 2024 with its new standards of measurement and targeting.
A state-of-the-art mobile DSP can provide comprehensive options to target the most relevant audience precisely. Our DSP solution helps advertisers achieve their strategic marketing goals due to efficient mobile campaigns and their precise attribution.
Measure and adjust your mobile ad campaigns effectively on SmartyAds DSP.

.webp)